 RSS Feed
 Twitter


Which area of Pakistan suffered the most in 2012?

In the terrorist’s arsenal, the bomb is perhaps the most devastating and cost effective. Its cost effectiveness is apparent when compared with armed assaults or other types of attacks.
Detonate a bomb from a distance, and you don’t lose any of your people, strap it on to one of yours, and that turns him/her into the worlds smartest smart bomb, one that is capable of doing the maximum damage by fine tuning its target till the final moment.
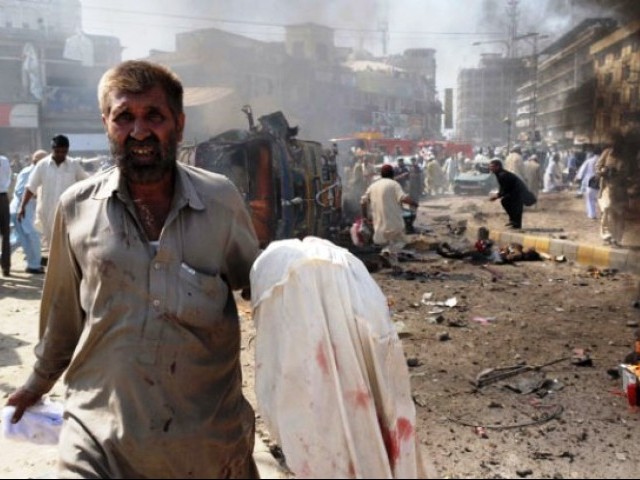
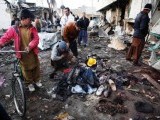
As a country that has been rocked by bombings since the 80s, Pakistan is one of the worst victims of bomb attacks. Such has been the death toll from these attacks, that bombings with single digit causality figures hardly make it to our 9pm headlines.
There is no doubt that Pakistan is the front line state in the war on terror, but then, is all of Pakistan a front line state, or does this front line of ours have corners of bliss? Ones where the sound of a bombing comes only through the ticker on news channels?
In my search for answers, I stumbled upon this excellent data source: the South Asian Terrorism Portal (SATP). It has statistics on terrorism in Pakistan as well as other countries in the region.
One such data series was the number of bomb blasts detailed according to cities. Using this data I mapped* the bombings for 2012.
One thing to remember is that this mapping is limited to just bombings and not armed assaults like the ones that happened in Gilgit Baltistan, when Shias were lined up outside buses and shot. Its important to point out that target killings, ambushes, beheadings as well as kidnappings occur frequently in Pakistan. The violence in Karachi appears especially low when only bombings are taken into account. According to SATP for 2012, the highest number or terrorism related deaths amongst the provinces were reported from Sindh at 1,553, followed by Balochistan at 954, KP at 656, and Punjab at 104. But I could not find the district level breakup of this data, any leads to other data sources would be much appreciated.
What I mapped is an indicator for the overall damage. Since the website provides the number of dead and injured for each bombing, I randomly assigned weights to these numbers; 0.8 for the dead and 0.2 for the injured. So a bombing with 10 dead and 20 injured gets a damage score of 12. While one with 10 dead and 40 injured gets a higher score of 16, thus differentiating between their level of damage.
The figure below shows the cumulative annual district wise scores across Pakistan. A total of 648 bombings were reported across the country in 2012 leading to 1007 deaths.
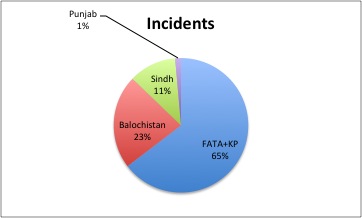
The mapping points out three zones of high incidence of bomb attacks. Districts marked in red fall in the “Very HIGH” category of damage. In total the districts/agencies marked in red account for 61% of the incidents and 79% of the deaths. These red areas are concentrated in three distinct zones.
Zone 1 includes, Peshawar, Kohat, Nowshehra and D.I.Khan from Khyber Pakhtunkhwa, while Khyber, Kurram, Bajaur, Orakzai, and Mohmand agencies from FATA. This zone accounts for 39% percent of all the bomb blasts in 2012, and 59% of the deaths as a result of bomb blasts. The worst bombing of the year was carried out in Jamrud bazaar on the 10th of January 2012, in which 35 people died while 78 were injured.
Zone 2 includes the districts of Quetta, Mastung, Dera Bugti and Sibi from Balochistan, where the damage is in the “Very HIGH” category. This zone accounts for 16% percent of all the bomb blasts and 16% percent of the deaths in 2012.
Zone 3 includes the various districts of Karachi and Malir, this accounts for 7% percent of the total bomb blasts and 4% percent of the killings.
The provincial break up of incidents and killed vs injured also reveal the share of the damage between provinces.
If we lump FATA and KP together, then it accounts for 65% of the incidents and 71% of the bombing related deaths in 2012.

There is a big difference among incidents in terms of impact; a cycle bomb and a C4 laden water tanker would both be qualified as “incidents” in our listing but then in terms of impact and the ruthlessness as well as capabilities of its planners, there is a huge difference.
So which districts are at the mercy of the worst villains?
For this we look at the damage per incident or the average damage for these districts. I am keeping districts with less than 15 bombings out of this calculation, as a lower denominator is not good for a representative average. Again the districts from Zone 1 show the highest damage per attack.
| DIST_NAME | KILLED | INJURED | INCIDENTS | DAMAGE = (0.2*Injured) + (0.8*Killed) | Average Damage |
| Bajaur Agency | 53 | 107 | 12 | 445.4 | 37.11666667 |
| Kurram Agency | 67 | 152 | 19 | 566.4 | 29.81052632 |
| Khyber Agency | 229 | 369 | 90 | 1905.8 | 21.17555556 |
| Peshawar | 144 | 413 | 75 | 1234.6 | 16.46133333 |
| Kohat | 37 | 62 | 19 | 308.4 | 16.23157895 |
| South Waziristan Agency | 19 | 41 | 10 | 160.2 | 16.02 |
| Quetta | 93 | 408 | 52 | 825.6 | 15.87692308 |
| Karachi | 40 | 280 | 45 | 376 | 8.355555556 |
| North Waziristan Agency | 11 | 35 | 12 | 95 | 7.916666667 |
| Nowshera | 13 | 93 | 22 | 122.6 | 5.572727273 |
| Mohmand Agency | 26 | 34 | 41 | 214.8 | 5.23902439 |
| Dera Bugti | 22 | 58 | 43 | 187.6 | 4.362790698 |
| Charsadda | 4 | 36 | 27 | 39.2 | 1.451851852 |
| Swabi | 1 | 25 | 24 | 13 | 0.541666667 |
Here is the district wise list of incidents and damage, ranked according to damage. Only those districts are included that came under atleast one bombing attack during 2012.
| DISTRICT NAME | KILLED | INJURED | INCIDENTS | DAMAGE = (0.2*Injured) + (0.8*Killed) |
| Khyber Agency | 229 | 369 | 90 | 1905.8 |
| Peshawar | 144 | 413 | 75 | 1234.6 |
| Quetta | 93 | 408 | 52 | 825.6 |
| Kurram Agency | 67 | 152 | 19 | 566.4 |
| Bajaur Agency | 53 | 107 | 12 | 445.4 |
| Karachi | 40 | 280 | 45 | 376 |
| Kohat | 37 | 62 | 19 | 308.4 |
| Orakzai Agency | 34 | 42 | 8 | 280.4 |
| Mastung | 29 | 67 | 4 | 245.4 |
| Mohmand Agency | 26 | 34 | 41 | 214.8 |
| Dera Bugti | 22 | 58 | 43 | 187.6 |
| Rawalpindi | 21 | 30 | 1 | 174 |
| Rahim Yar Khan | 21 | 27 | 1 | 173.4 |
| Sibi | 19 | 59 | 4 | 163.8 |
| South Waziristan Agency | 19 | 41 | 10 | 160.2 |
| D. I. Khan | 18 | 51 | 5 | 154.2 |
| Lower Dir | 17 | 17 | 4 | 139.4 |
| Nowshera | 13 | 93 | 22 | 122.6 |
| Killa Abdullah | 14 | 7 | 1 | 113.4 |
| North Waziristan Agency | 11 | 35 | 12 | 95 |
| Bannu | 10 | 36 | 4 | 87.2 |
| Upper Dir | 8 | 19 | 3 | 67.8 |
| Kech | 7 | 16 | 4 | 59.2 |
| Buner | 7 | 5 | 1 | 57 |
| Lahore | 5 | 67 | 3 | 53.4 |
| Jaffarabad | 5 | 2 | 6 | 40.4 |
| Charsadda | 4 | 36 | 27 | 39.2 |
| Nasirabad | 4 | 31 | 9 | 38.2 |
| Kohlu | 4 | 3 | 6 | 32.6 |
| Lakki Marwat | 4 | 2 | 9 | 32.4 |
| Hangu | 3 | 10 | 8 | 26 |
| Bhakkar | 3 | 0 | 1 | 24 |
| Jacobabad | 2 | 10 | 1 | 18 |
| Bolan | 2 | 6 | 4 | 17.2 |
| Zhob | 2 | 0 | 1 | 16 |
| Swabi | 1 | 25 | 24 | 13 |
| Panjgur | 1 | 10 | 3 | 10 |
| Kalat | 1 | 4 | 2 | 8.8 |
| Shangla | 1 | 4 | 1 | 8.8 |
| Vehari | 1 | 2 | 1 | 8.4 |
| Khuzdar | 1 | 1 | 2 | 8.2 |
| Loralai | 1 | 1 | 1 | 8.2 |
| Malakand PA | 1 | 1 | 1 | 8.2 |
| Tribal Area adj Tank | 1 | 1 | 1 | 8.2 |
| Tribal Area adj Kohat | 1 | 0 | 1 | 8 |
| Hyderabad | 0 | 9 | 12 | 1.8 |
| Mardan | 0 | 8 | 13 | 1.6 |
| Tribal Area adj Bannu | 0 | 6 | 2 | 1.2 |
| Tank | 0 | 5 | 5 | 1 |
| Barkhan | 0 | 3 | 1 | 0.6 |
| Nawabshah | 0 | 3 | 4 | 0.6 |
| Attock | 0 | 2 | 1 | 0.4 |
| Mansehra | 0 | 2 | 1 | 0.4 |
| Pishin | 0 | 2 | 1 | 0.4 |
| Chagai | 0 | 1 | 1 | 0.2 |
| Islamabad | 0 | 1 | 1 | 0.2 |
| Larkana | 0 | 1 | 2 | 0.2 |
| Badin | 0 | 0 | 1 | 0 |
| Ghotki | 0 | 0 | 1 | 0 |
| Khairpur | 0 | 0 | 3 | 0 |
| Multan | 0 | 0 | 1 | 0 |
| Naushahro Feroze | 0 | 0 | 3 | 0 |
| Shikarpur | 0 | 0 | 1 | 0 |
| Sukkur | 0 | 0 | 1 | 0 |
| Ziarat | 0 | 0 | 1 | 0 |
——————————————————–


0 comments:
Post a Comment